Using datasets from the Australian Bureau of Statistics (ABS) and Jobs and Skills Australia (JSA), the Regional Australia Institute (RAI) provides a monthly snapshot of the regional labour market, offering insights into key indicators for job vacancies, labour force size, participation rate, employed population and unemployment rate. This analysis not only captures current labour market dynamics but also examines historical trends to provide a comprehensive perspective for regional Australia.
For this report, regional Australia is defined as all parts of Australia outside the five metropolitan cities with populations exceeding one million people-Sydney, Melbourne, Brisbane, Adelaide and Perth
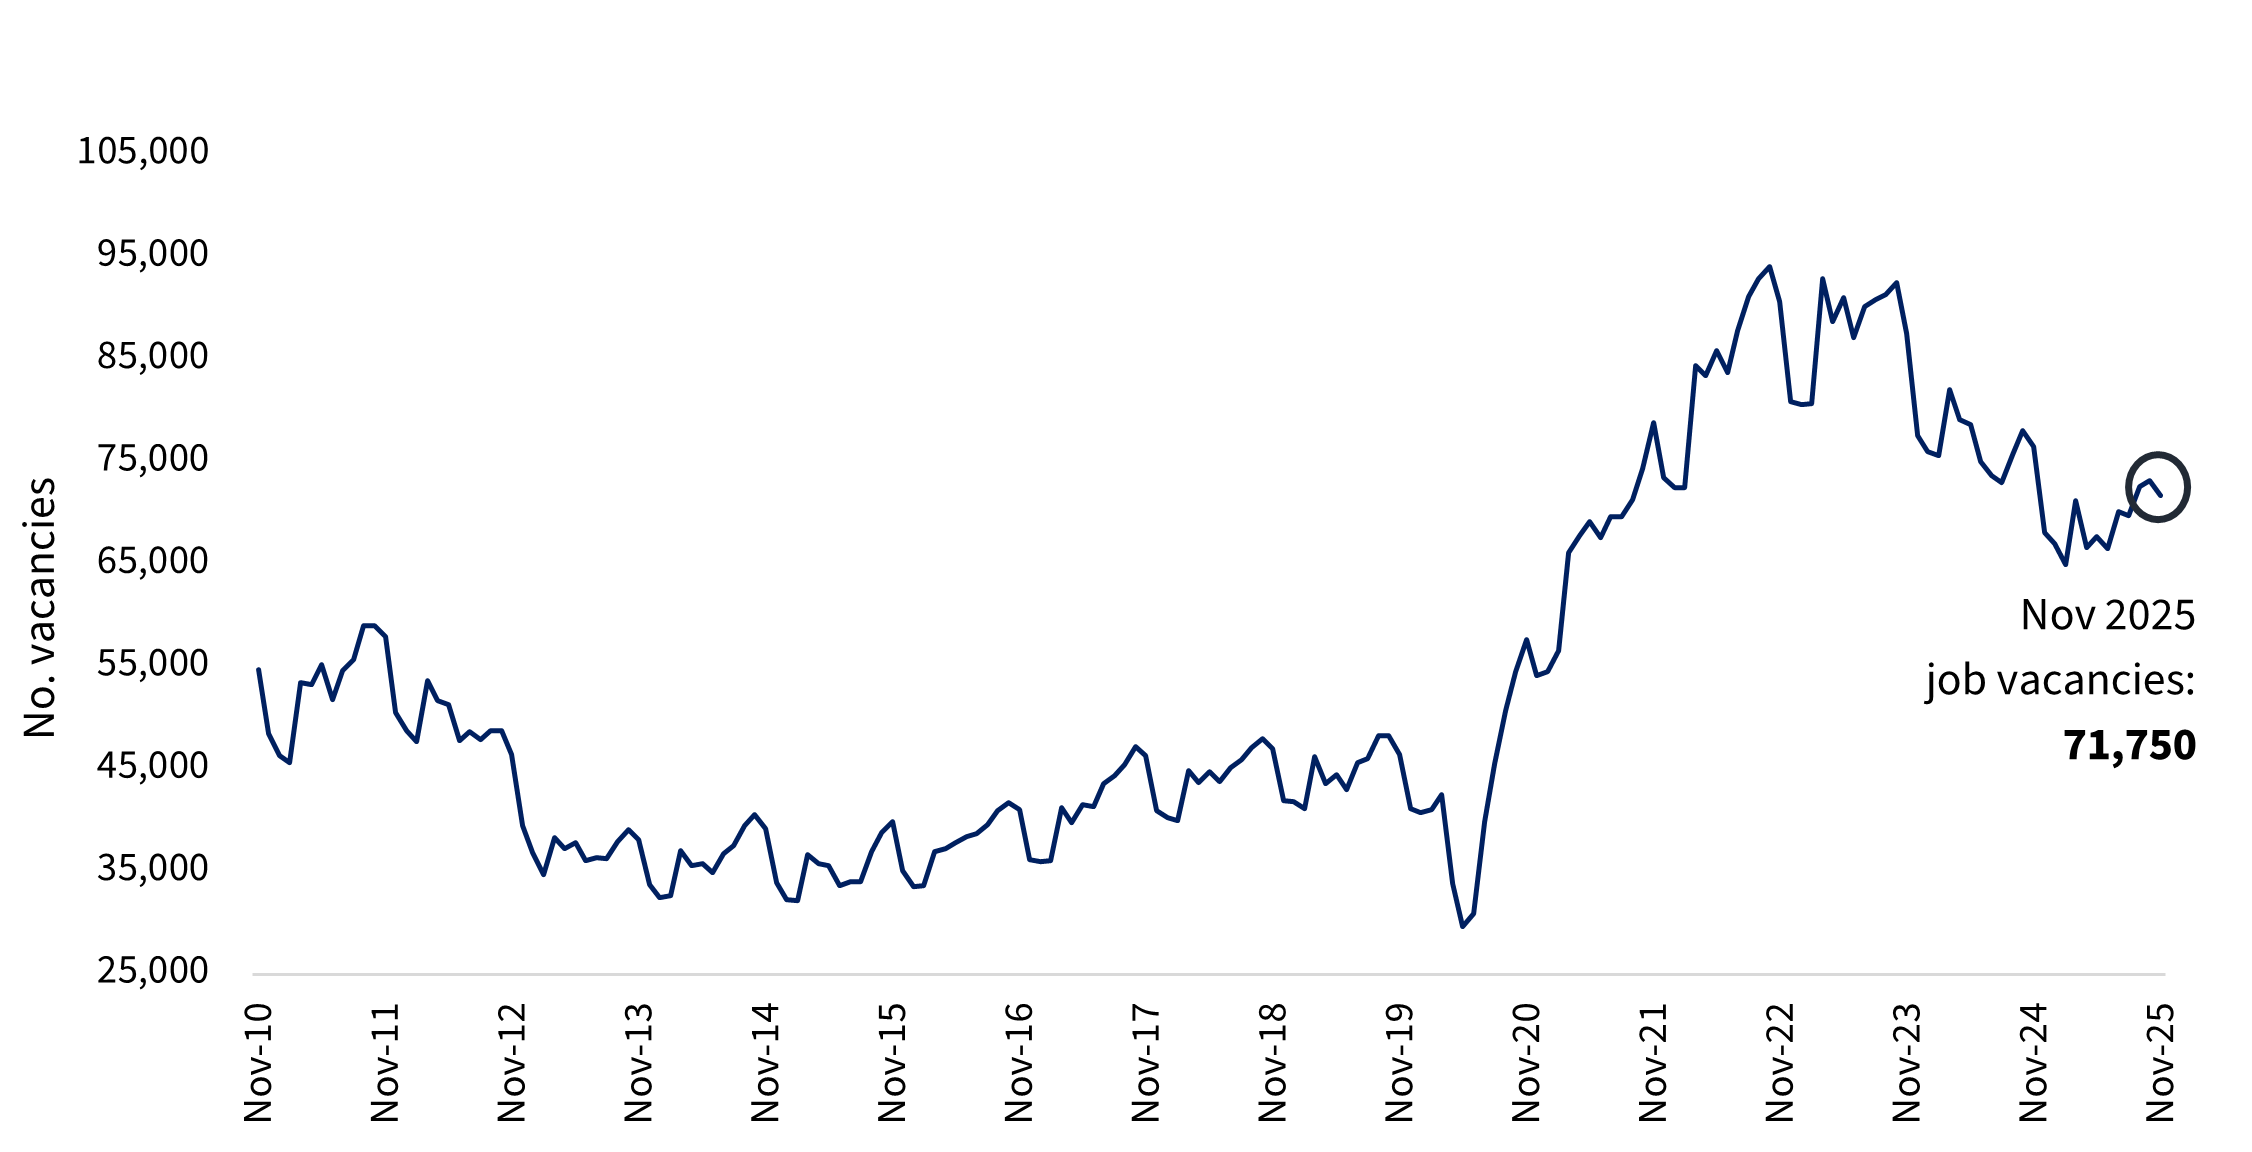
Regional Job Vacancies
Regional job vacancies dipped by 1.9% in November, following some rises in the previous months. There were 71,750 online advertisements across regional Australia, 6.2% lower than a year earlier.
Regional Australia Job Vacancies
Source: Jobs and Skills Australia, monthly internet vacancies, RAI
The top three occupational categories for job vacancies:
- Professionals (27%)
- Technicians and Trade Workers (16%)
- Community and Professional Service Workers (13%).
While vacancies declined across regions in aggregate during the month, several regions diverged from this overall trend and recorded increases in vacancies. The five regions with the strongest month-on-month growth were:
- Outback Queensland up by 3.2%
- Fleurieu Peninsula & Murray Mallee in SA up by 2.7 %
- Southern Highlands & Snowy in NSW up by 1.7%
- Northwest Tasmania up by 0.7%
- Tamworth and North West NSW up by 0.6%
The top five regions with the largest year-on-year increases in vacancies (November 2025 compared with November 2024) were:
- Tamworth and North West NSW up by 15.5%
- Dubbo & Western NSW up by 5.9%
- Goldfields & Southern WA up by 5.4%
- NSW North Coast up by 4.5%
- Port Augusta & Eyre Peninsula in SA up by 4.3%
| State/Territory |
Nov-25 |
Oct-25 |
%Change (monthly) |
Nov-24 |
%Change (Annually) |
| Regional Australia |
71,751 |
73,174 |
-1.90% |
76,506 |
-6.20% |
| Regional NSW |
20,458 |
20,786 |
-1.60% |
20,846 |
-1.90% |
| Regional Vic |
9,637 |
9,823 |
-1.90% |
10,324 |
-6.60% |
| Regional Qld |
23,712 |
24,126 |
-1.70% |
24,845 |
-4.60% |
| Regional SA |
2,066 |
2,044 |
1.10% |
2,017 |
2.40% |
| Tas |
3,177 |
3,264 |
-2.70% |
3,643 |
-12.80% |
| Regional WA |
5,013 |
5,113 |
-1.90% |
5,241 |
-4.40% |
| NT |
2,946 |
3,076 |
-4.20% |
3,361 |
-12.30% |
| ACT |
4,742 |
4,942 |
-4.10% |
6,231 |
-23.90% |
| Mainland Capital Cities |
138,034 |
142,382 |
-3.10% |
150,689 |
-8.40% |
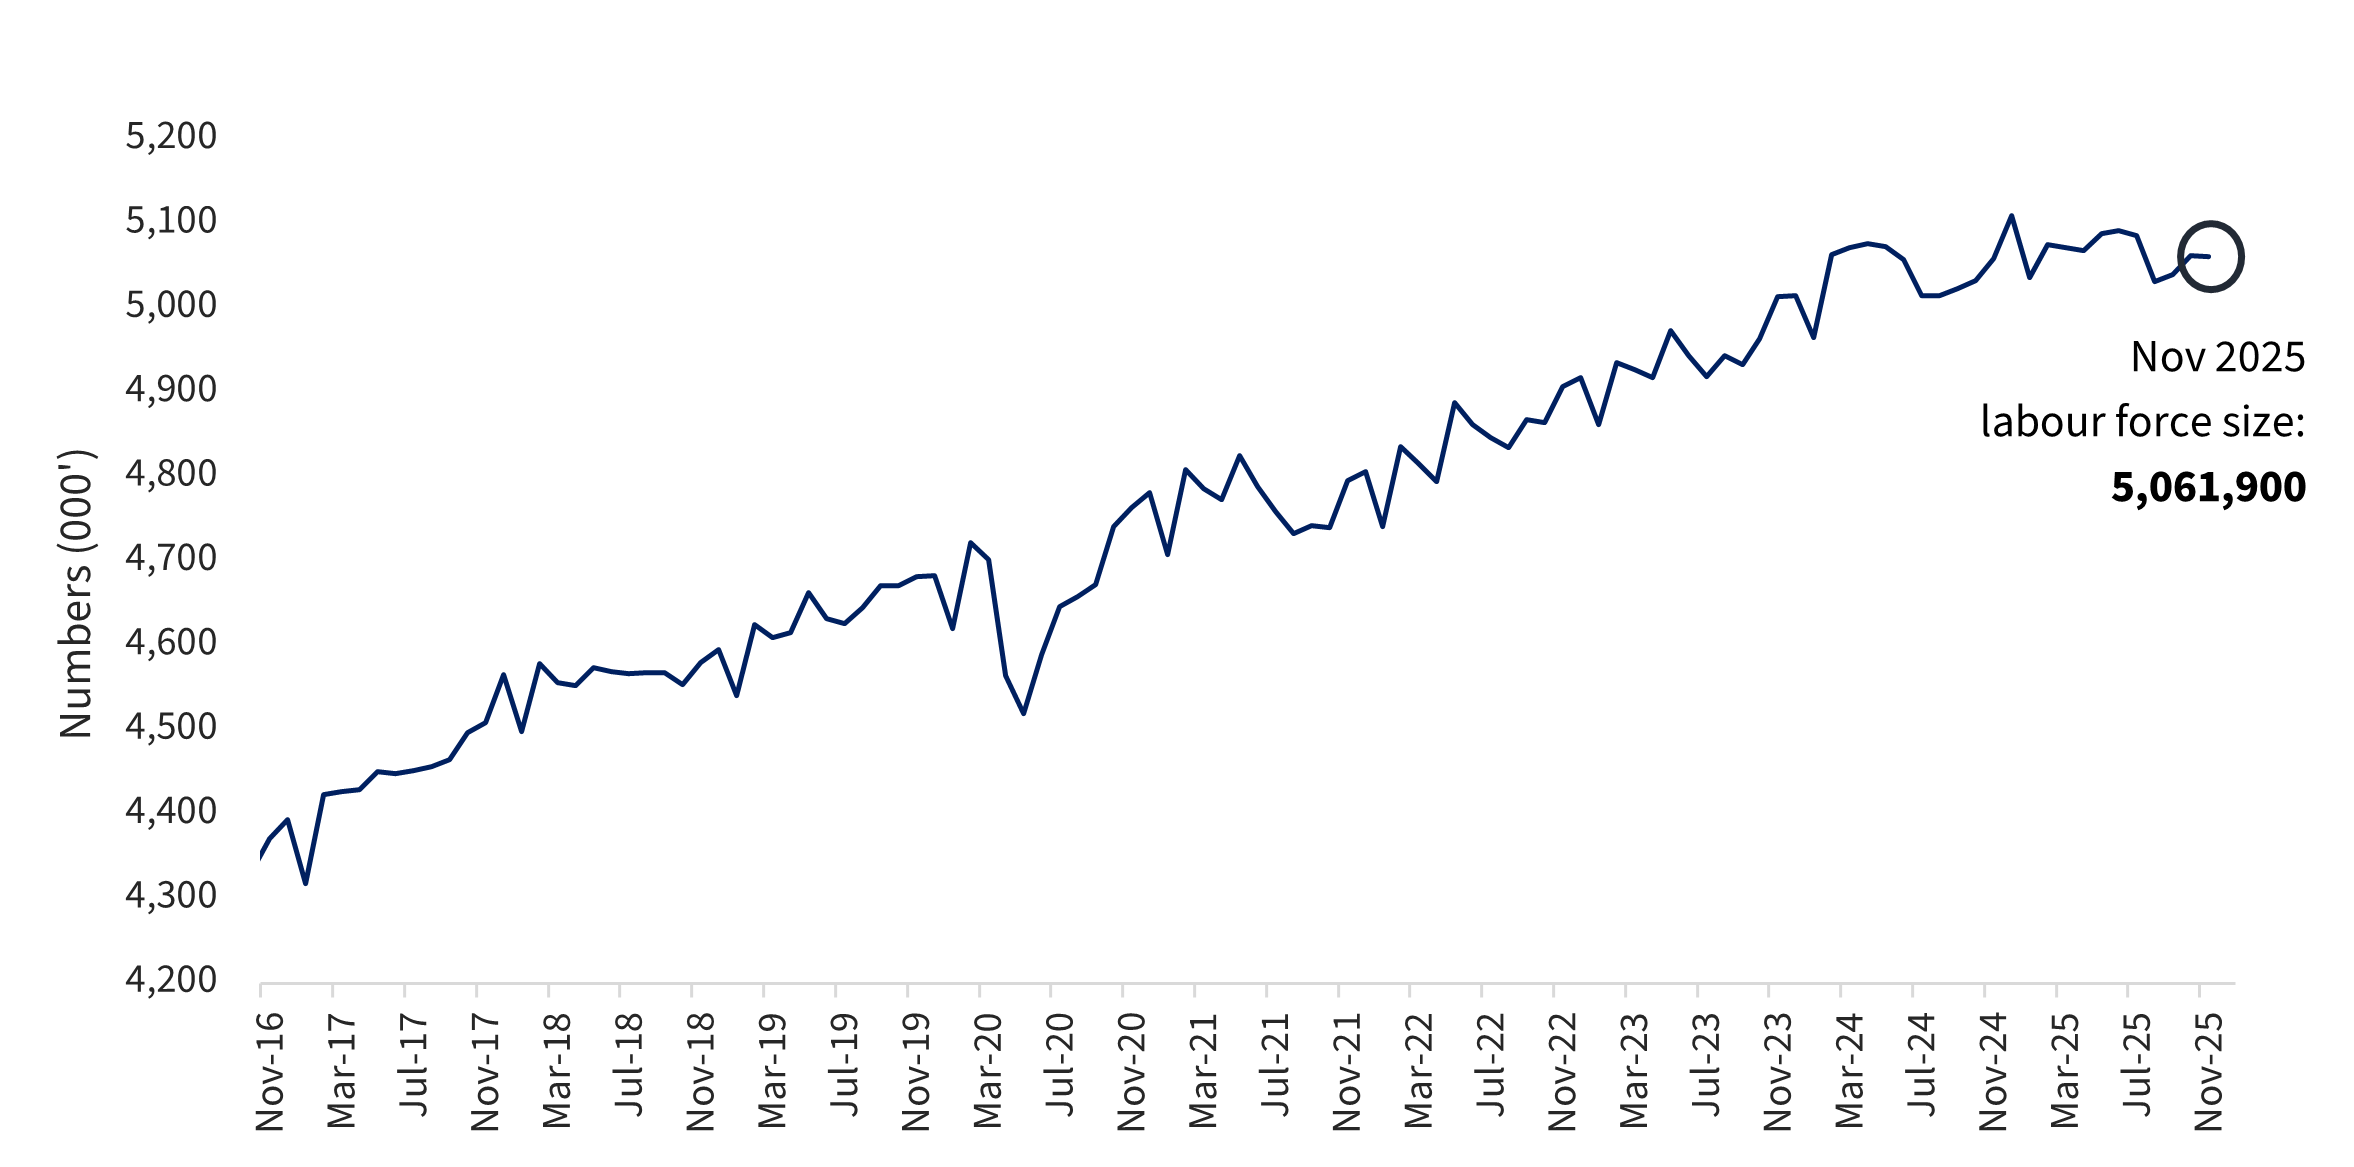
Regional Labour Force
In November, the regional labour force remained steady at 5.06 million, with no material change from the previous month. While the size of the regional labour force has fluctuated over time, it has demonstrated a sustained upward trend over the longer term, broadly reflecting regional population growth and increasing demand for regional employment. This trend also indicates positive labour market engagement, with more people participating in the workforce in response to emerging job opportunities.
Regional Australia labour force size
Source: ABS Labour Force (detailed), RAI
The table below presents the regional labour force size by state and territory and its share of total. Queensland has the largest regional labour force with 1,491,360 people, making up nearly 50% of the state’s total labour force. For Tasmania, the Northern Territory and the Australian Capital Territory, the entire jurisdiction is classified as regional Australia.
| State / Territory |
Regional Labour Force Size (‘000) |
Percentage of state/ territory labour force (%) |
| New South Wales |
1,472.00 |
31.4 |
| Victoria |
845.8 |
21 |
| Queensland |
1,491.40 |
47.7 |
| South Australia |
197.7 |
19.1 |
| Western Australia |
322.1 |
18.6 |
| Tasmania |
296 |
100 |
| Northern Territory |
152.4 |
100 |
| Australian Capital Territory |
284.5 |
100 |
| Australia |
5,061.90 |
33 |
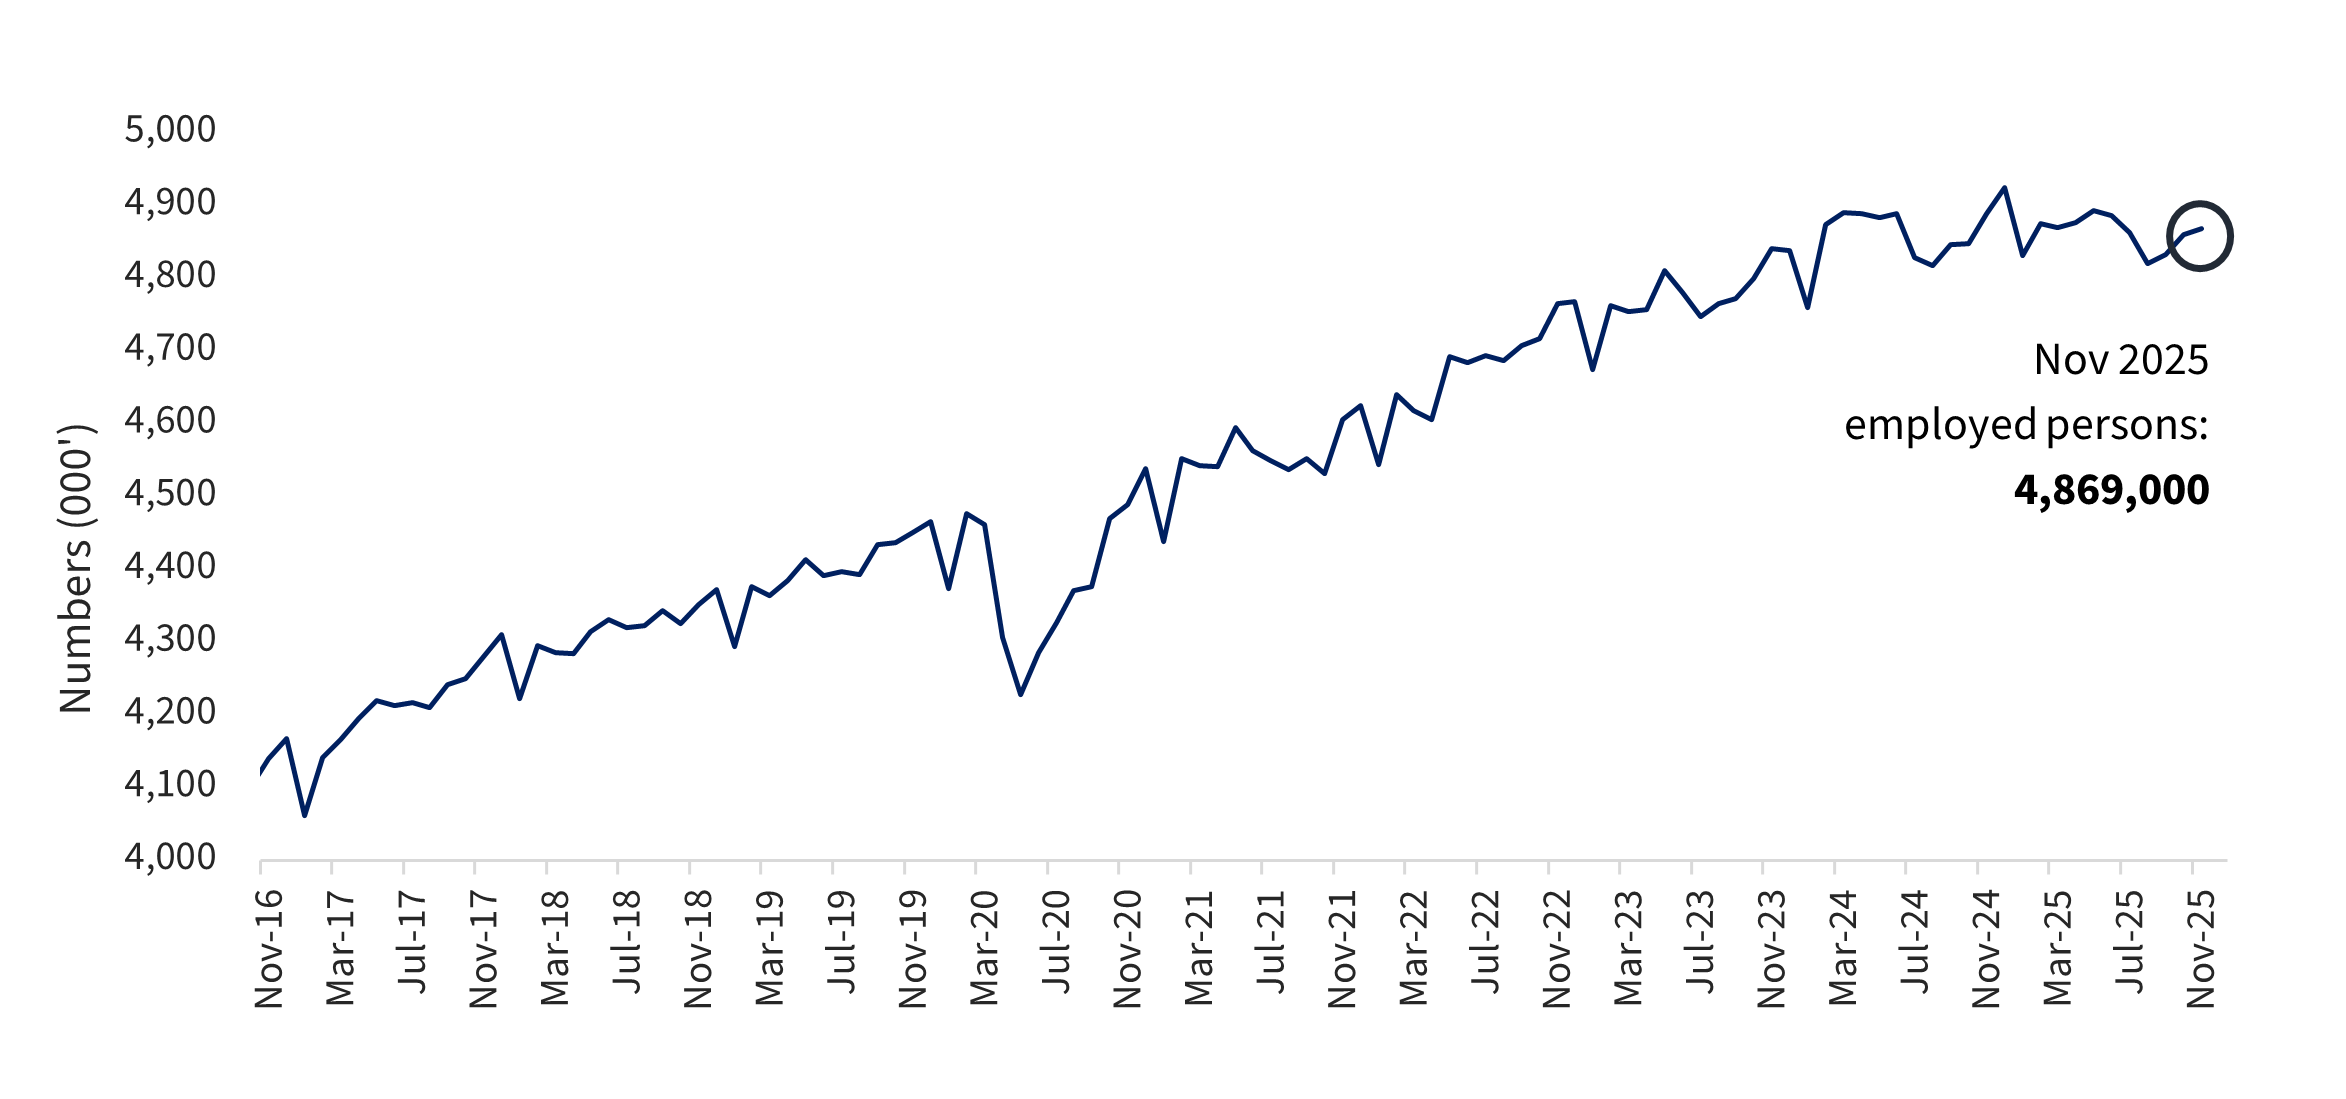
Regional Employed Persons
The number of employed people in regional Australia reached 4,869,000 in November, 0.2% higher than in October. The growth in employed people is a sign that more people are successfully matching with regional employment opportunities.
Regional Australia employed people
Source: ABS Labour Force (detailed), RAI
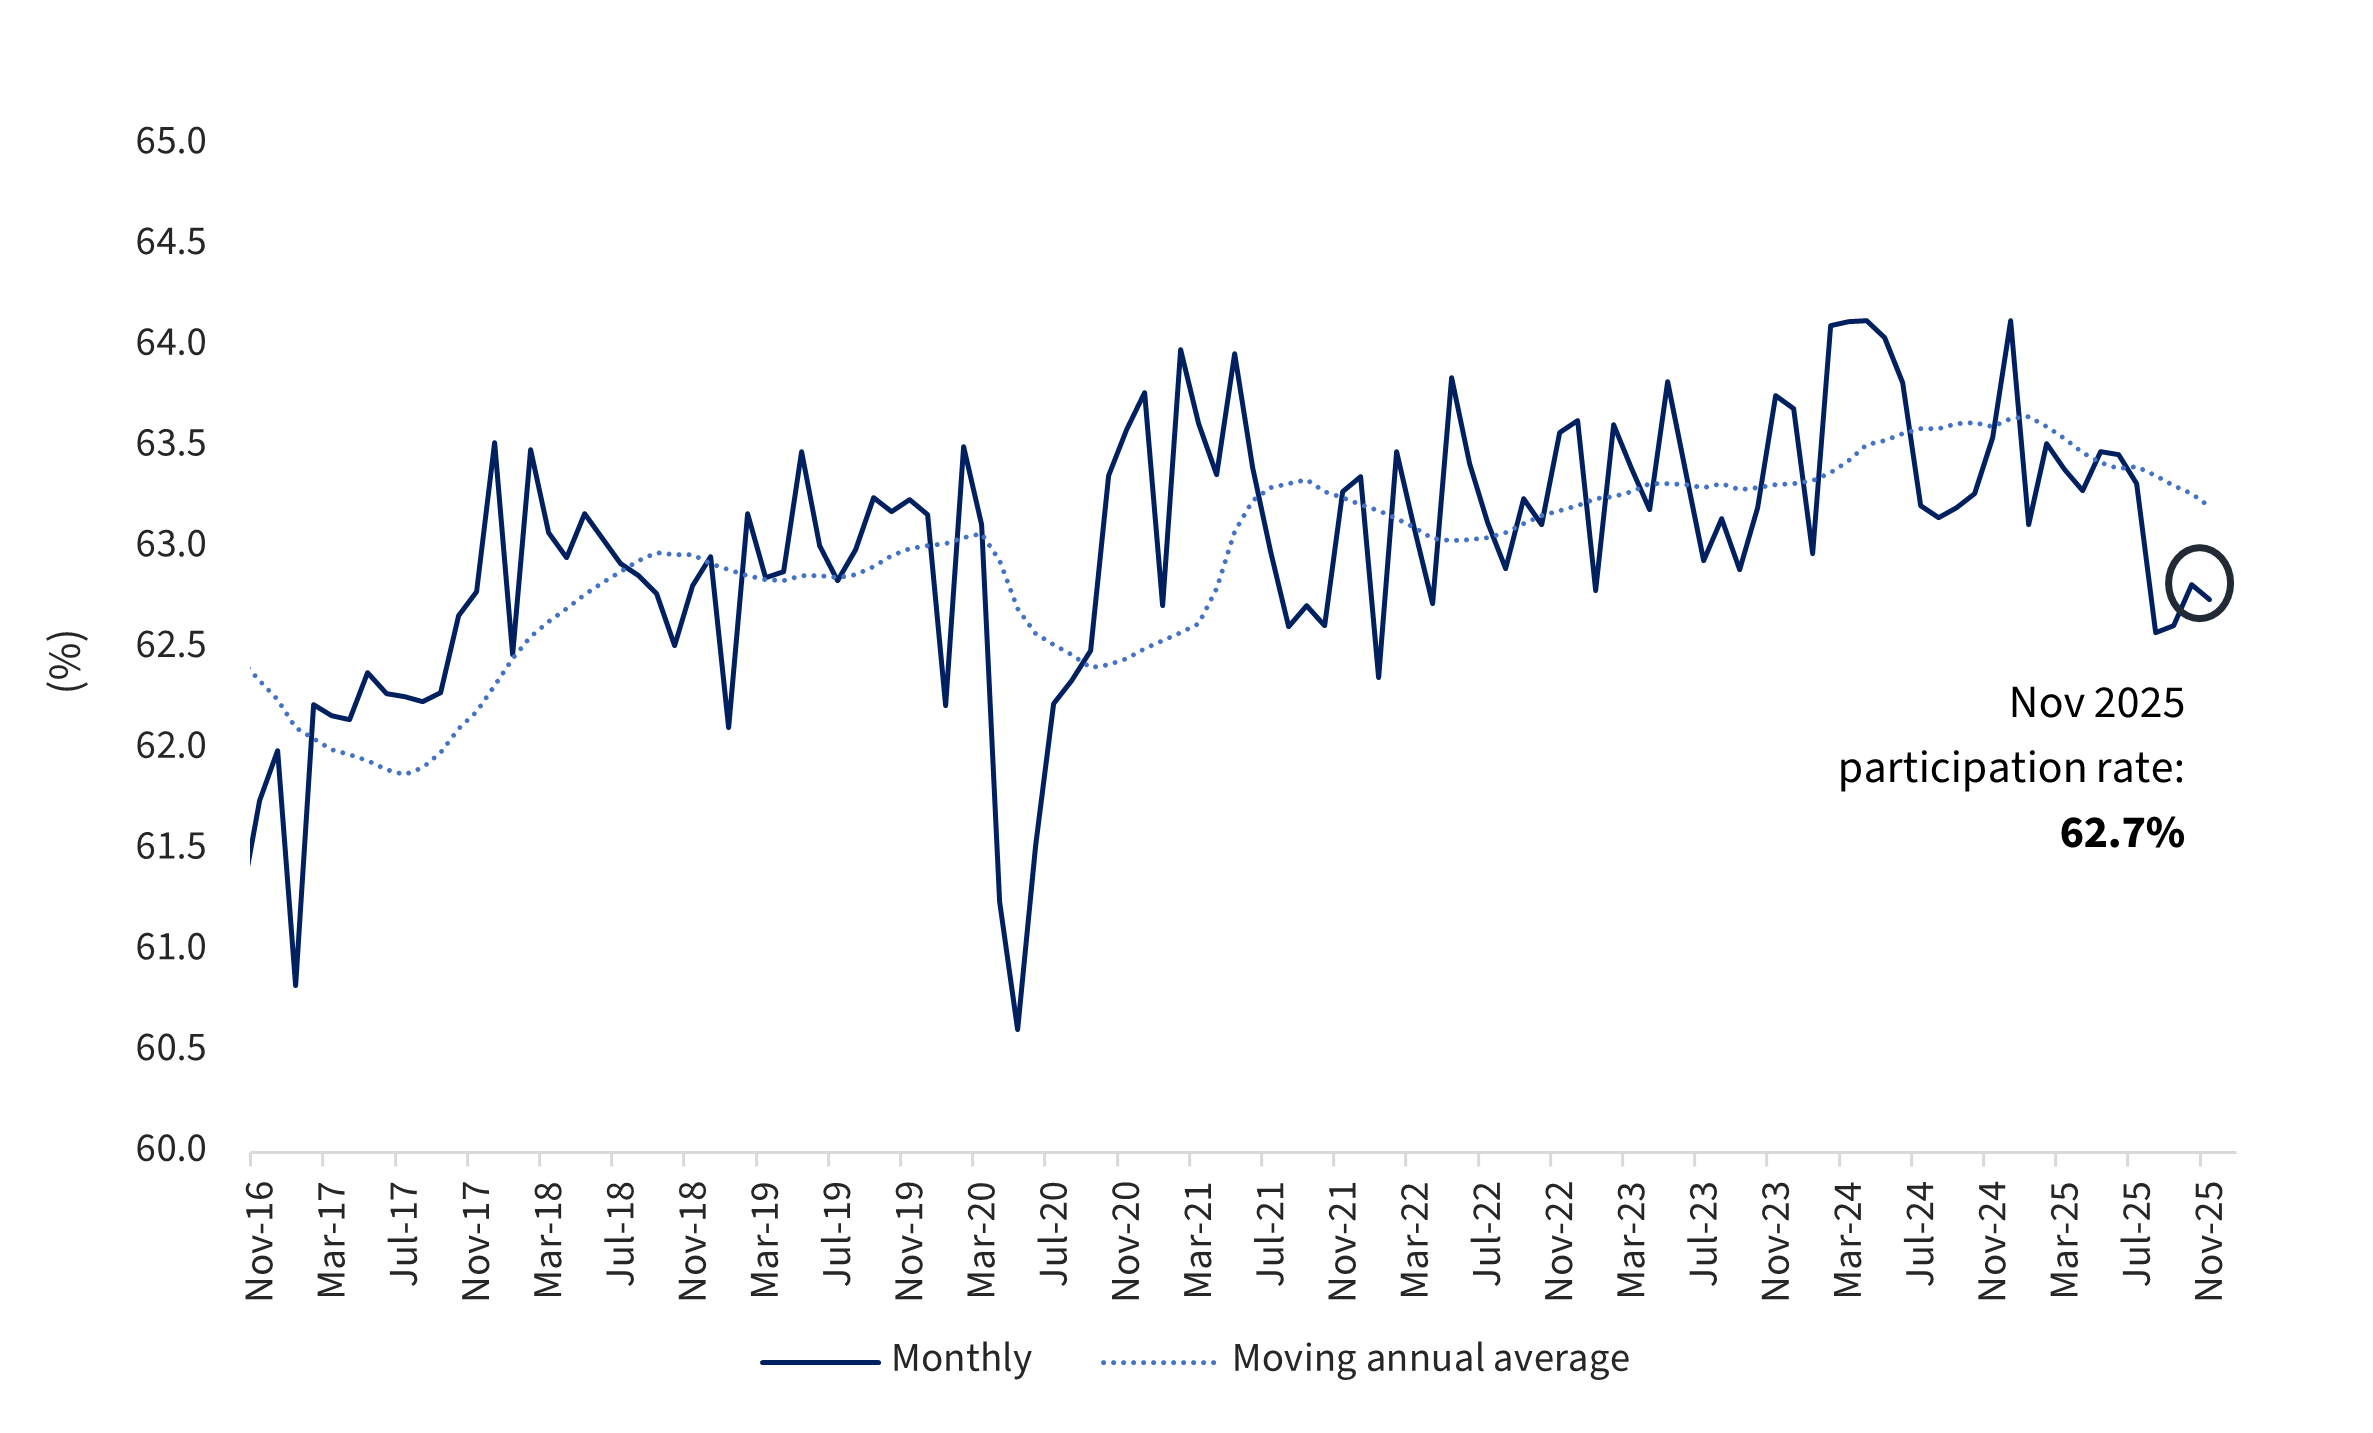
Regional Australia Participation Rate
The regional Australia participation rate has decreased slightly from 62.8% in October to 62.7% in November. When smoothing out seasonal fluctuations, the annual moving average also drecreased from 63.3% to 63.2%. However, the regional labour participation is fairly stable in the long-term.
Regional Australia Participation Rate
Source: ABS Labour Force (detailed) RAI
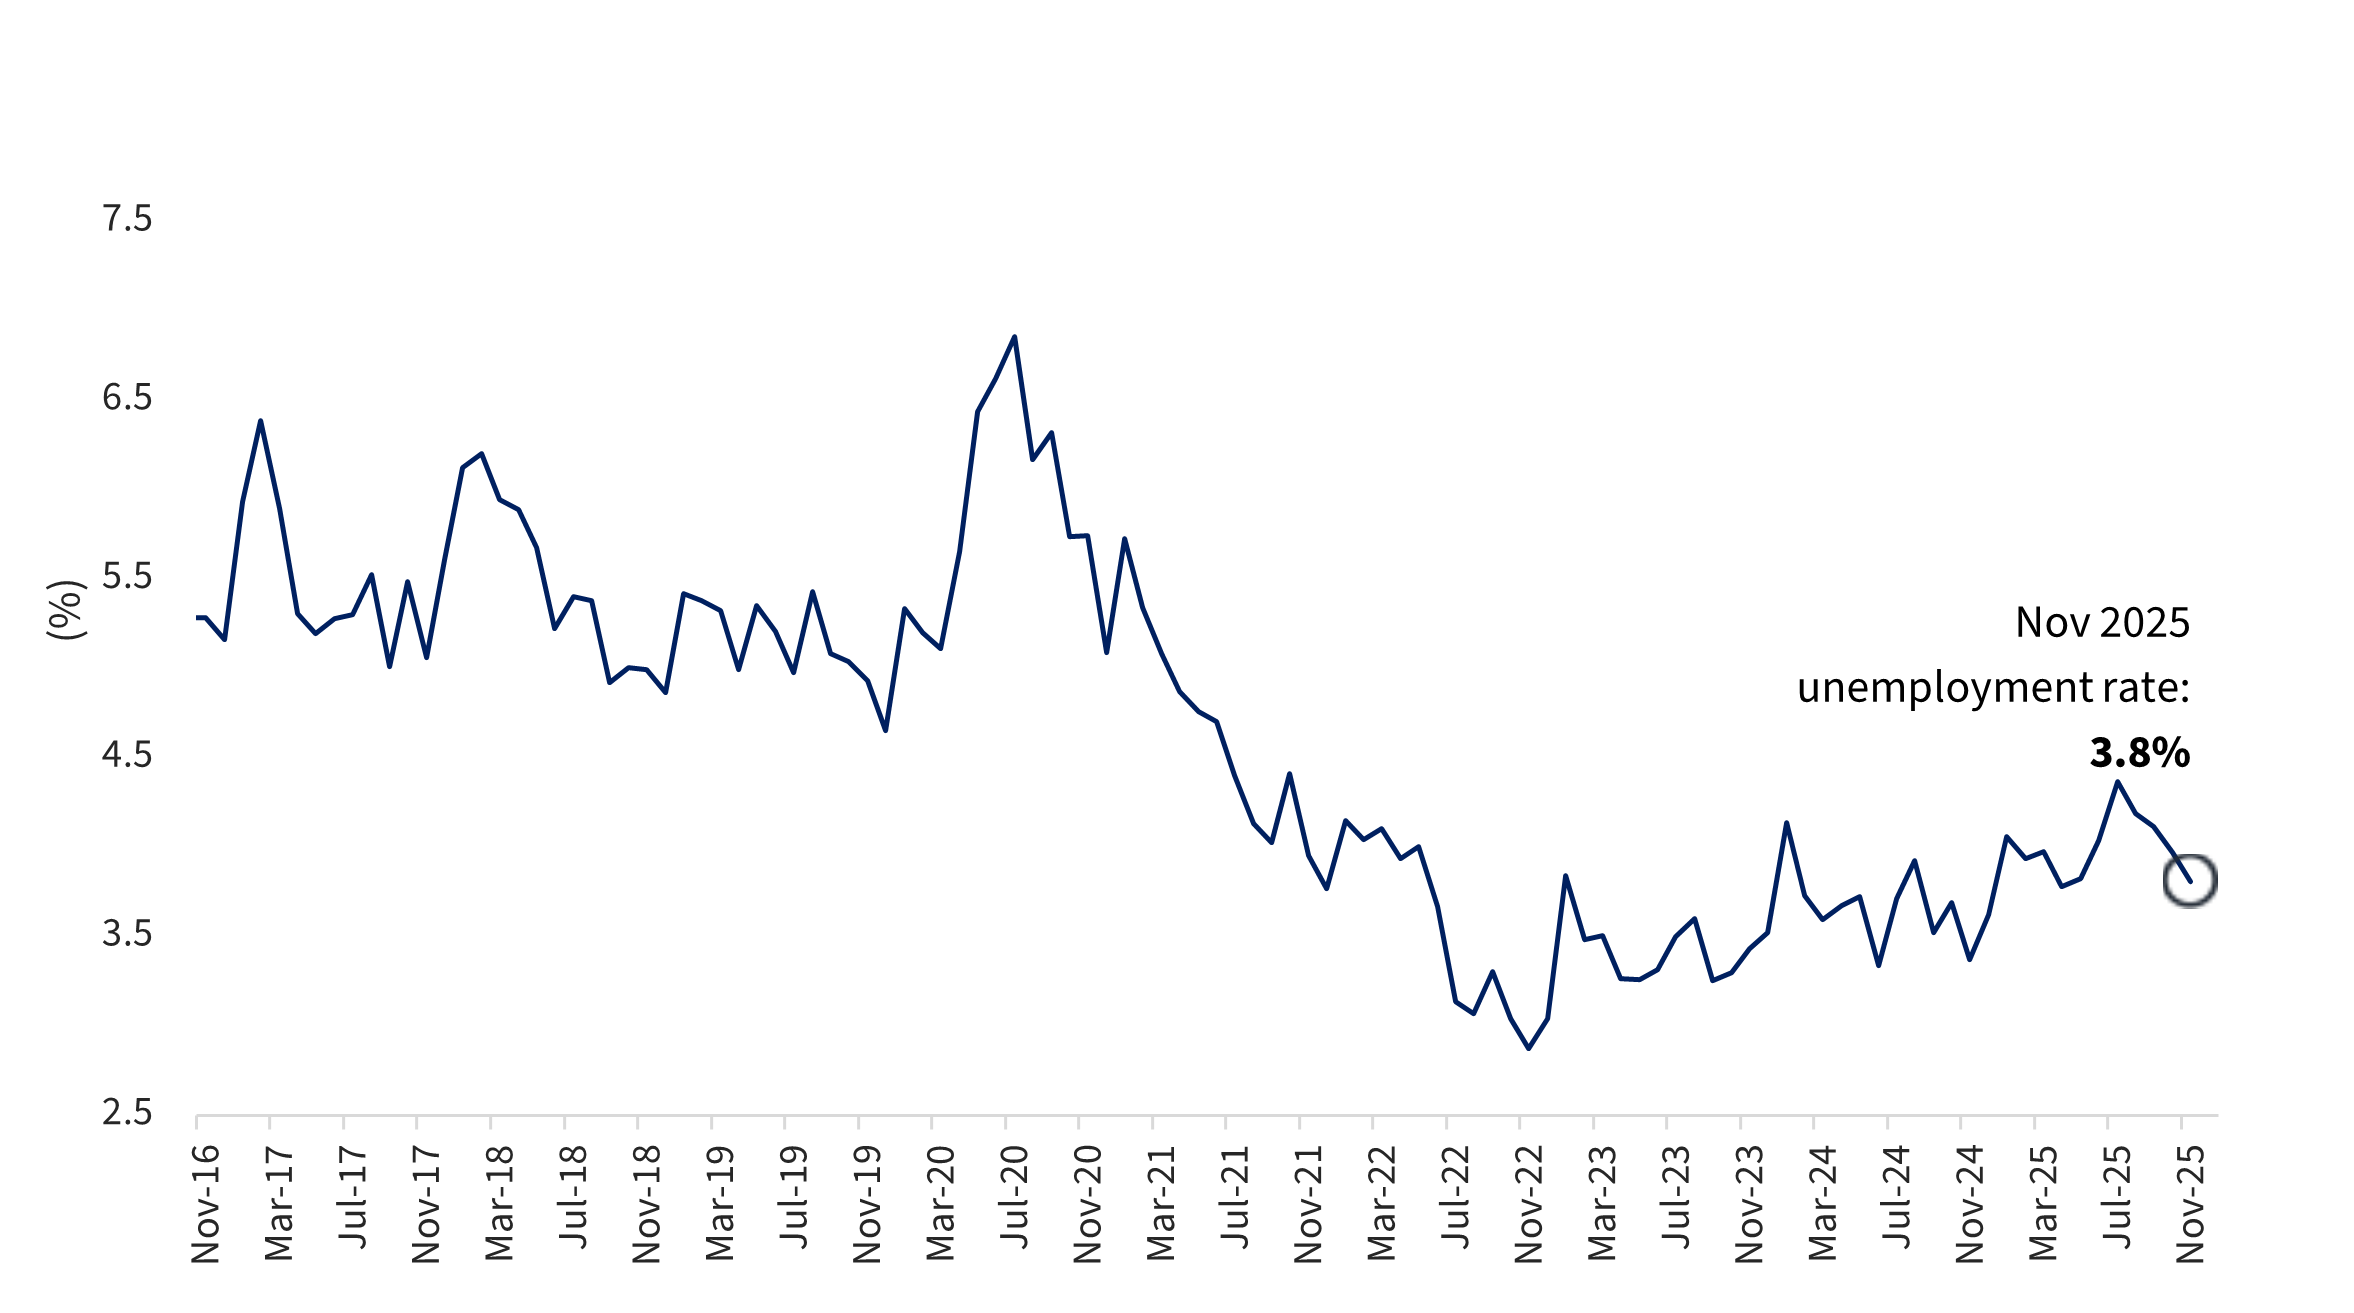
Regional Australia Unemployment Rate
The regional unemployment rate continued to decline to 3.8% in November. While there are month-to-month fluctuations, the unemployment rate has generally remained at historically low levels. This indicates a highly efficient regional labour market, where most job seekers are able to secure employment and employers are largely able to absorb available labour. At the same time, it reflects ongoing tightness in regional labour markets, consistent with persistent labour shortages and difficulty filling vacant roles.
Regional Australia Unemployment Rate
Source: ABS Labour Force (detailed) RAI