Using datasets from the Australian Bureau of Statistics (ABS) and Jobs and Skills Australia (JSA), the Regional Australia Institute (RAI) provides a monthly snapshot of the regional labour market, offering insights into key indicators for job vacancies, labour force size, participation rate, employed population and unemployment rate. This analysis not only captures current labour market dynamics but also examines historical trends to provide a comprehensive perspective for regional Australia.
Regional Australia is defined as all parts of Australia outside the five metropolitan cities with populations exceeding one million people-Sydney, Melbourne, Brisbane, Adelaide and Perth.
The December 2025 labour market data shows an expected seasonal softening in regional jobs vacancies but continuing tightness and strength in regional labour markets overall. Improvements in employment, participation, and unemployment indicate that labour demand remains broadly balanced by supply. Widespread lower regional job vacancies than this time last year, however, may point to a softening in regional labour markets in 2026.
Regional Job Vacancies
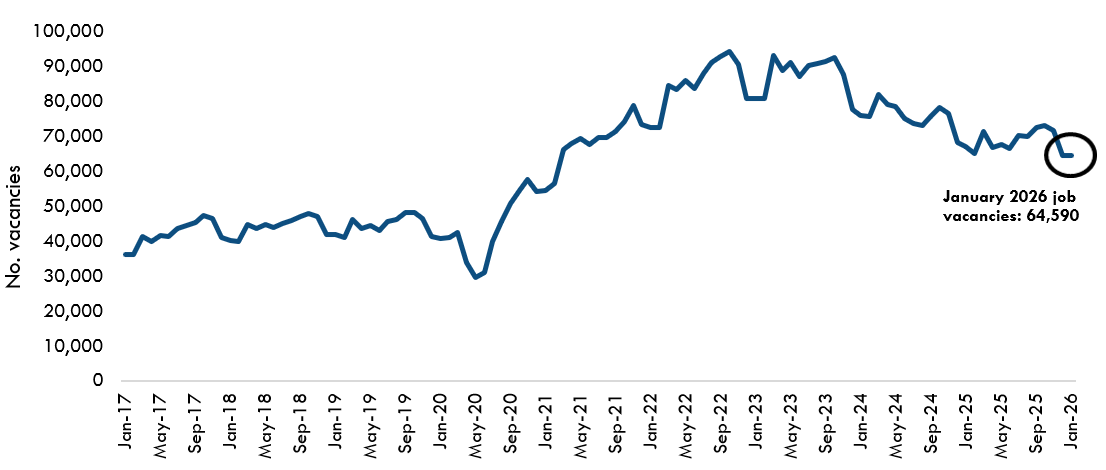
Regional job vacancies advertised online were 64,590 in January 2026, recording a slight increase of 0.3% compared with the previous month. However, vacancies were lower compared with the same period last year, recording an annual decrease of 3.6%. By comparison, metropolitan areas showed a more pronounced downward trend, with a monthly decrease of 0.7% and an annual decline of 5.3%.
Regional Australia Job Vacancies
Source: Jobs and Skills Australia, monthly internet vacancies, RAI
The top three occupational categories for job vacancies were Professionals (28%), Technicians and Trade Workers (16%) and Community and Professional Service Workers (13%).
The regions with the fastest monthly increases were:
- North West Tasmania (6.6%)
- Pilbara & Kimberley in WA (6.1%)
- Tamworth and North West NSW (4.5 %)
Regional job vacancies in all states and territories were lower than at the same time last year, with the exception of New South Wales. This reflects a widespread softening in regional job vacancies over the longer term. Capital cities have experienced a sharper annual reduction in jobs vacancies.
Number of advertised job vacancies
| Number
of job vacancies advertised online |
Jan-25 |
Dec-25 |
Jan-26 |
% change (monthly) |
% change (annual) |
| Regional Australia |
67,000 |
64,408 |
64,590 |
0.30% |
-3.60% |
| Regional NSW |
18,189 |
18,251 |
18,421 |
0.90% |
1.30% |
| Regional VIC |
9,115 |
8,816 |
8,744 |
-0.80% |
-4.10% |
| Regional QLD |
21,744 |
21,278 |
21,250 |
-0.10% |
-2.30% |
| Regional SA |
1,916 |
1,868 |
1,899 |
1.60% |
-0.90% |
| TAS |
3,273 |
2,857 |
2,952 |
3.30% |
-9.80% |
| Regional WA |
4,792 |
4,602 |
4,711 |
2.40% |
-1.70% |
| NT |
2,932 |
2,617 |
2,533 |
-3.20% |
-13.60% |
| ACT |
5,040 |
4,118 |
4,080 |
-0.90% |
-19.00% |
| Mainland Capital Cities |
127,453 |
121,502 |
120,679 |
-0.70% |
-5.30% |
Regional Labour Force
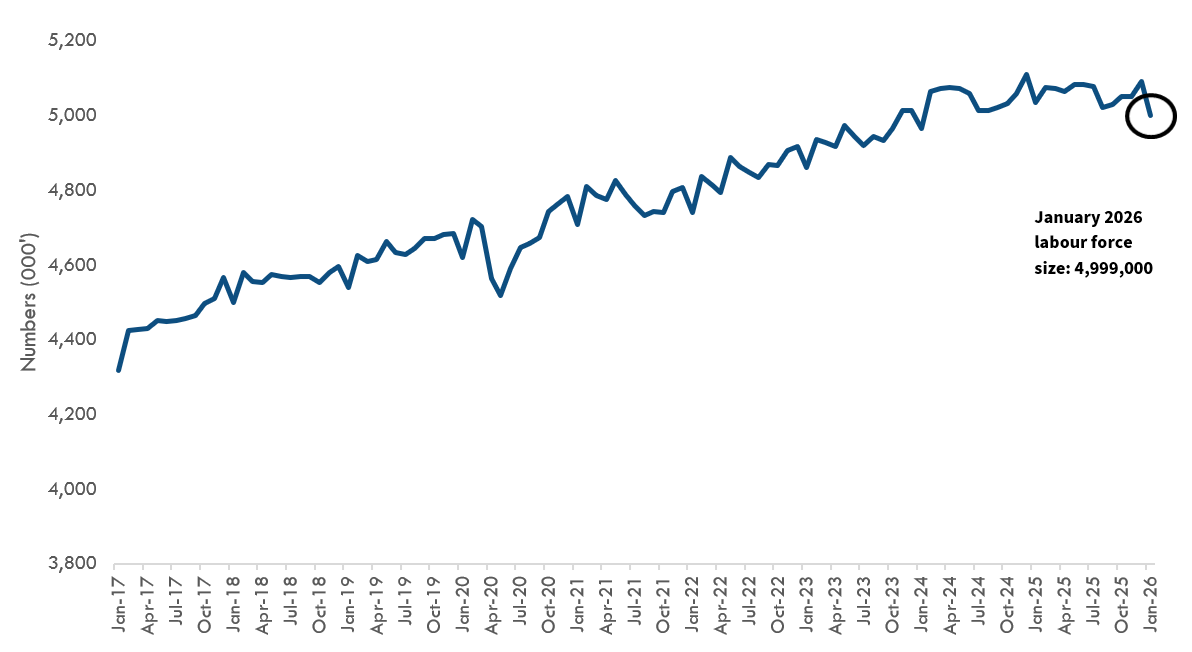
In January, the regional labour force fell to 4,999,000, representing a decrease of 1.9% from the previous month. The labour force measures all people employed or unemployed (and looking for work). While the regional labour force has experienced short-term fluctuations, the long-term trajectory remains upward, in line with regional population growth. It is also a positive sign that more people are engaging in the labour market.
Regional Australia labour force size
Source: ABS Labour Force (detailed), RAI
The table below presents the regional labour force size by state and territory. Queensland has the largest regional labour force with 1,484,100 people, making up 47.5% of the state’s total labour force. Western Australia has proportionally the smallest regional labour force at 18.0%. For Tasmania, the Northern Territory and the Australian Capital Territory, the entire jurisdiction is classified as regional Australia.
| State/Territory |
Regional Labour Force Size ('000) |
Percentage of total labour force (%) |
| NSW |
1,461.00 |
31.4 |
| Vic |
827.8 |
21 |
| Qld |
1,484.10 |
47.5 |
| SA |
194.4 |
18.9 |
| WA |
308.1 |
18 |
| Tas |
291.1 |
100 |
| NT |
150.6 |
100 |
| ACT |
282.1 |
100 |
| Australia |
4,999.20 |
32.9 |
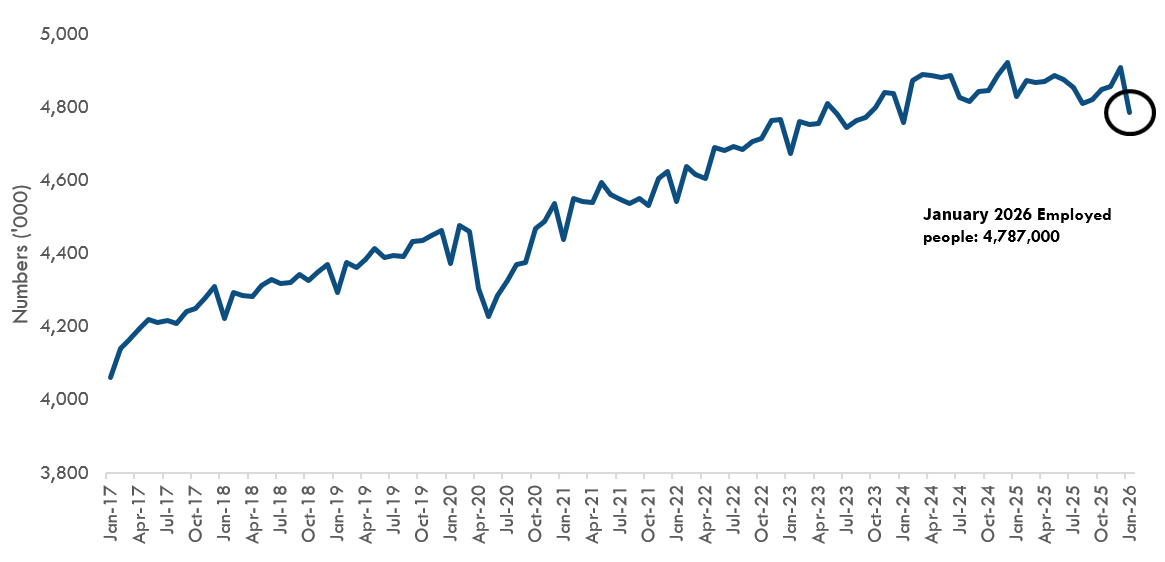
Regional Employed Persons
The number of employed people in regional Australia reached 4,787,000 in January, a decrease of 2.5% from December. Despite fluctuations, the long-term trend in employment remains upward.
Regional Australia employed people
Source: ABS Labour Force (detailed), RAI
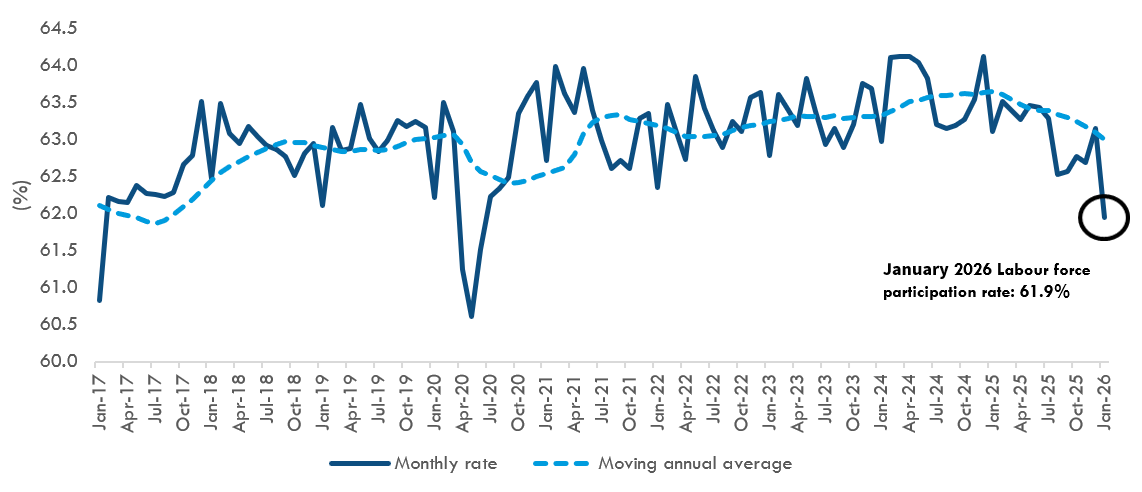
Regional Australia Participation Rate
The regional labour force participation rate fell to 61.9% in January 2025. Declines in participation from December to January are not unexpected due to seasonal factors, however this is the lowest monthly participation rate reading since the pandemic and is over 1 % lower than the previous January. When smoothing out seasonal fluctuations, the annual moving average is trending lower at 63.0% and the downward trend appears to be accelerating. Labour force participation measures the labour force as a percentage of all working-age people (aged 15 and over).
Regional Australia Participation Rate
Source: ABS Labour Force (detailed) RAI
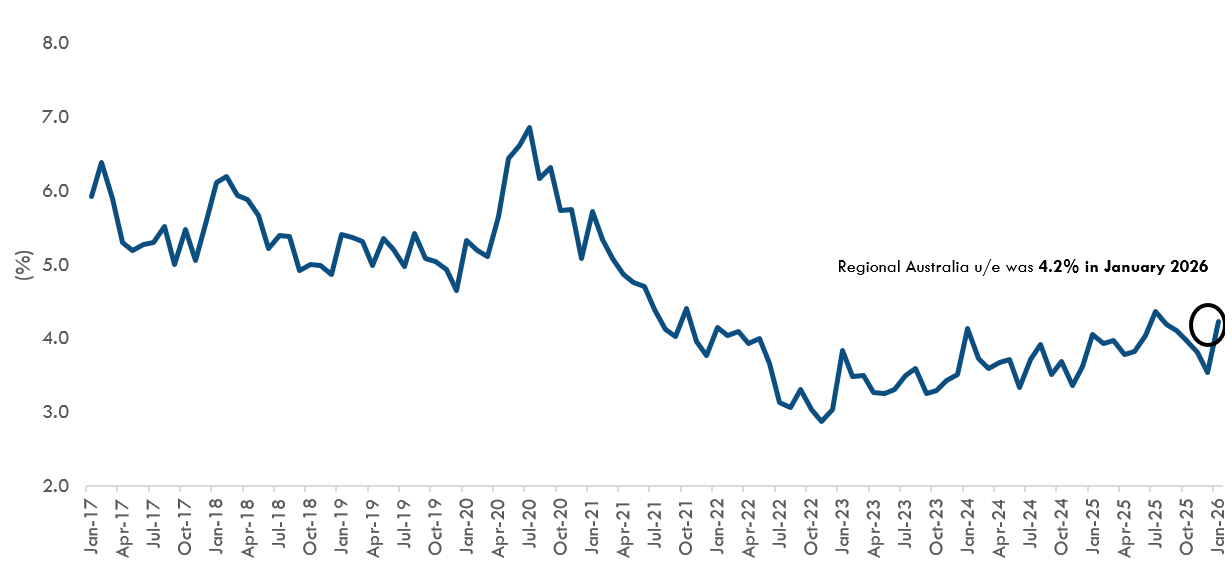
Regional Australia Unemployment Rate
The regional unemployment rate rose to 4.2% in January. Despite monthly variations, unemployment has generally remained at historically low levels, meaning there are fewer workers available to fill job vacancies. The recent upward trend in the regional unemployment rate, however, matches the softening reflected in the other labour market indicators above.
Regional Australia Unemployment Rate
Source: ABS Labour Force (detailed) RAI